Debug tooling
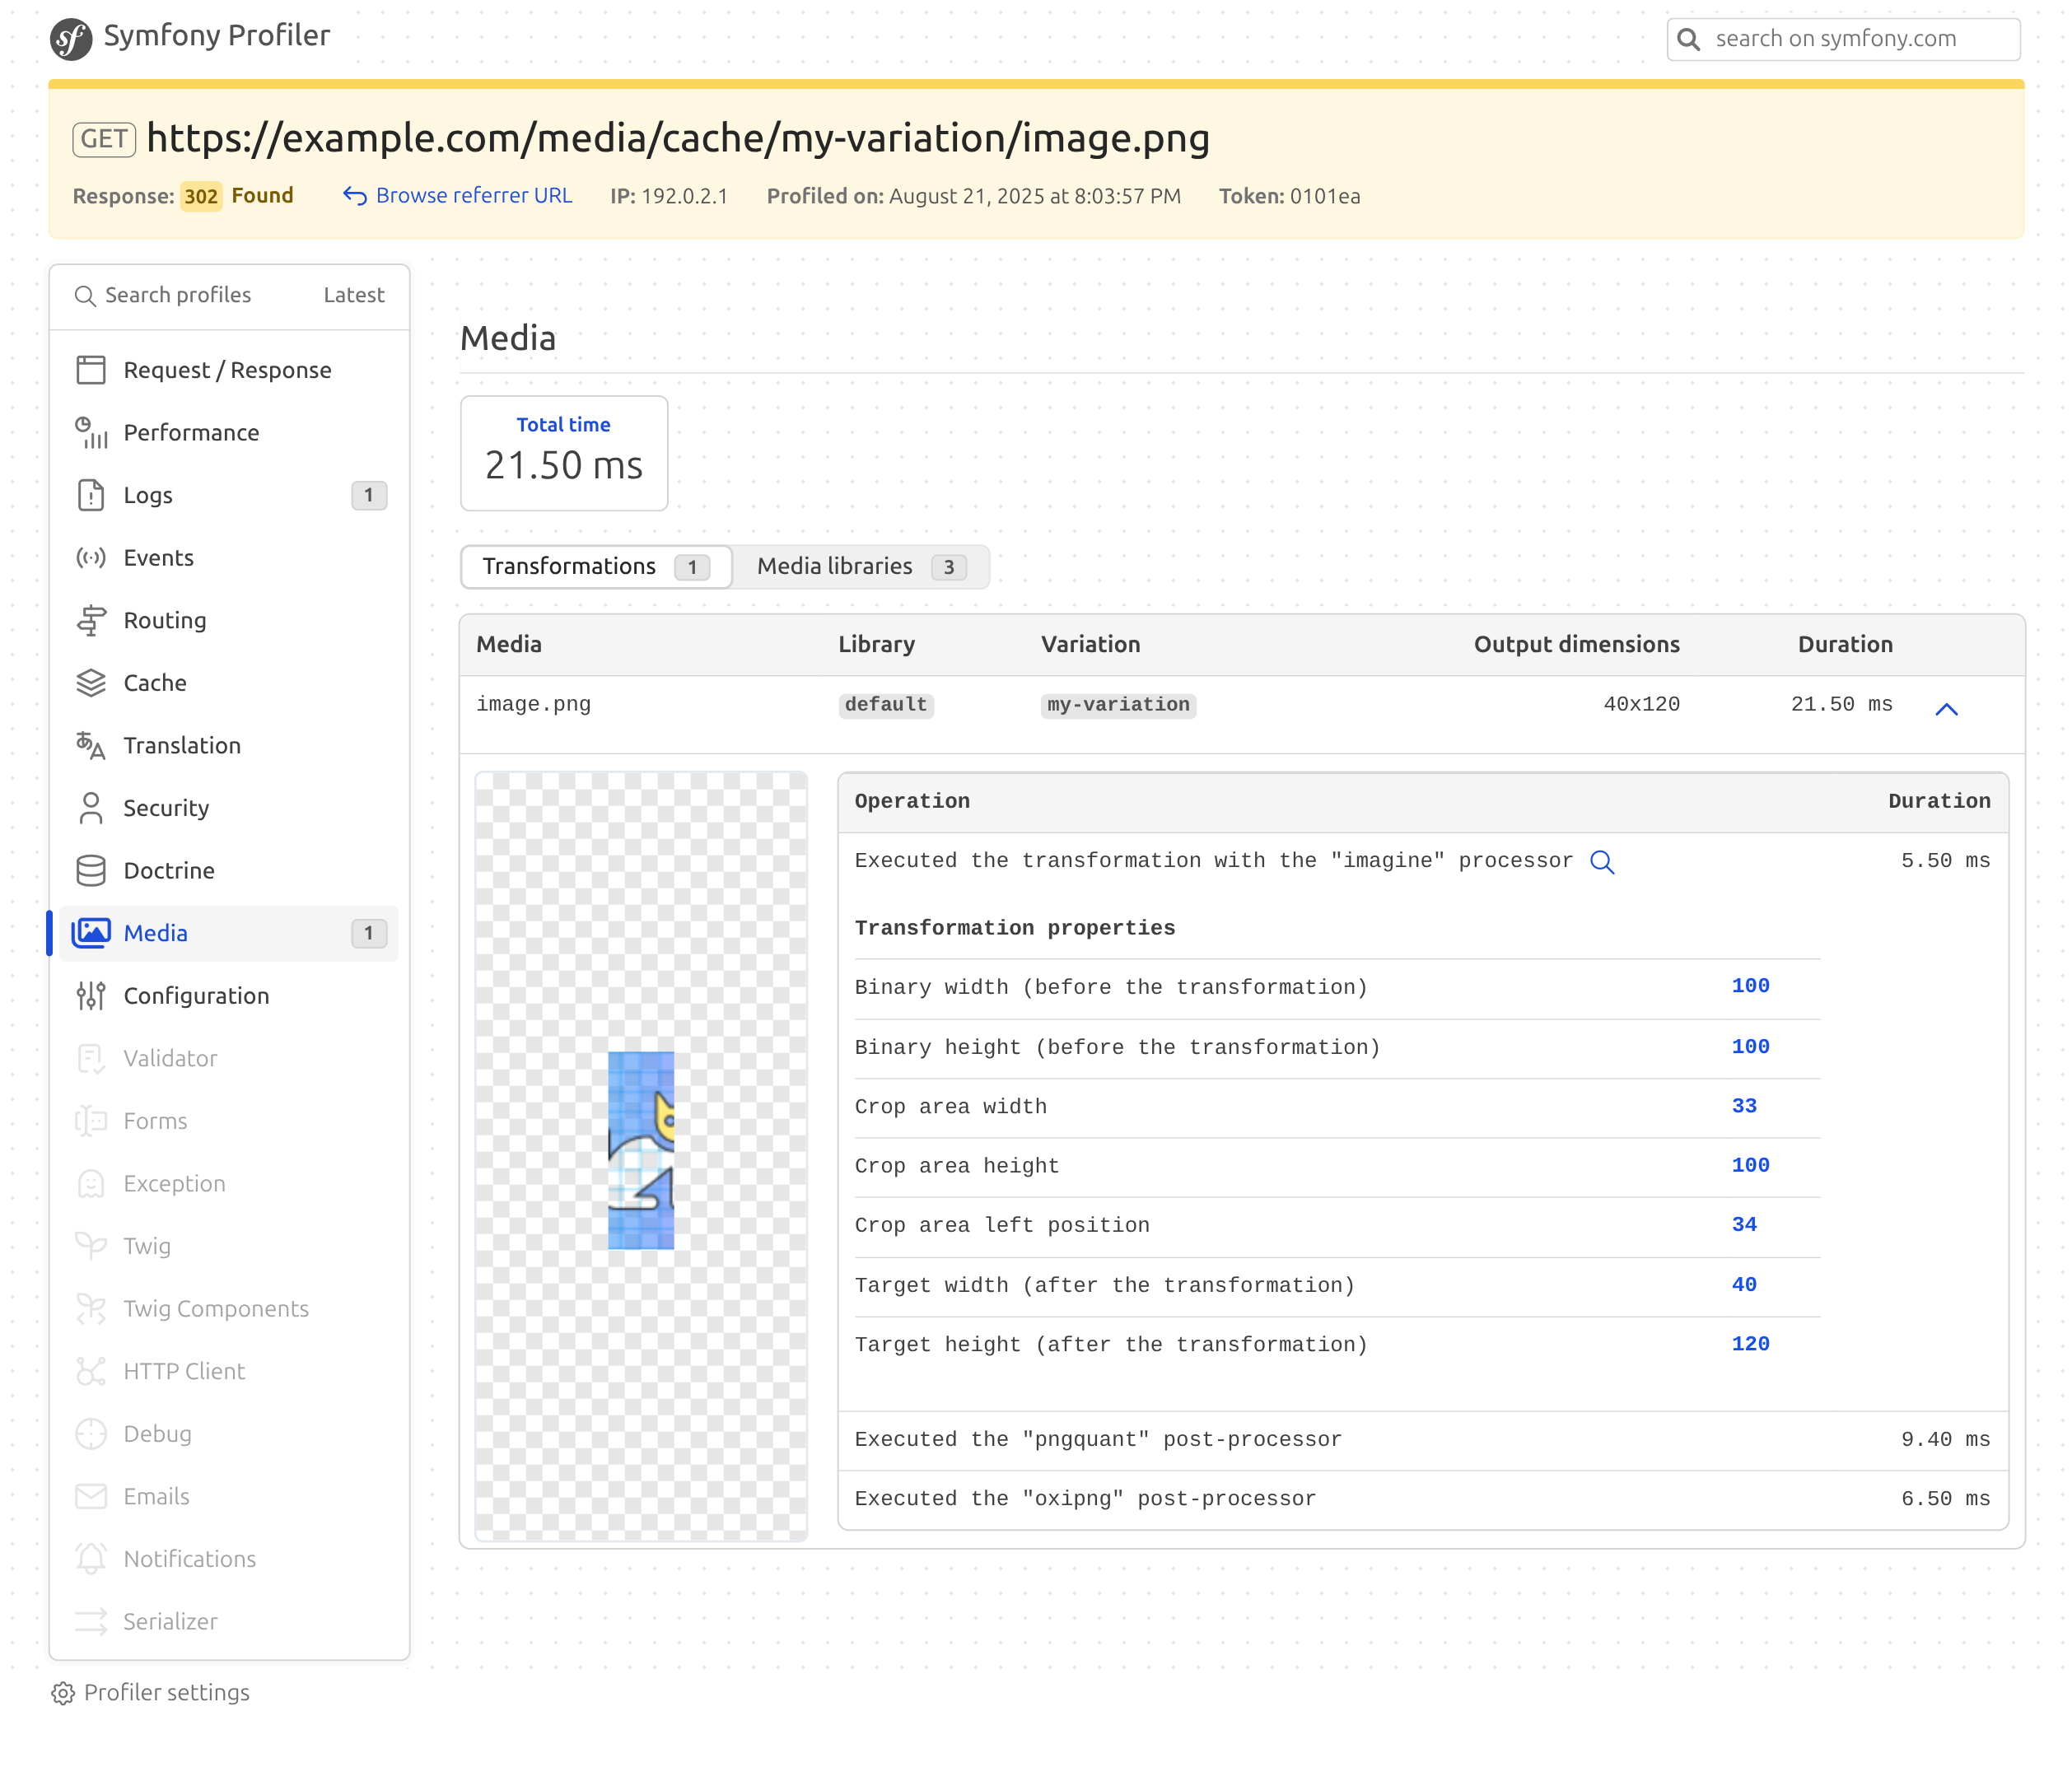
The MediaBundle includes a Web Profiler panel and a Web Developer Toolbar block, to help diagnose the media processing performed during a request.
The MediaBundle profiler panel provides information about the configured libraries and the transformations performed during the request. For each variation that has been computed, it displays the total computing time and information about each of the steps of the transformation pipeline (pre-processors, processors, post-processors).

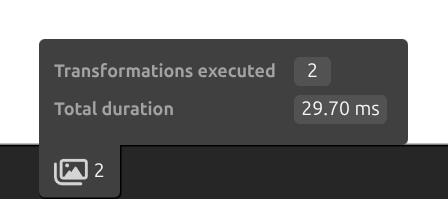
The Web Developer Toolbar block displays a summary of the media processing performed during the request, including the number of variations generated and the time spent processing media:
